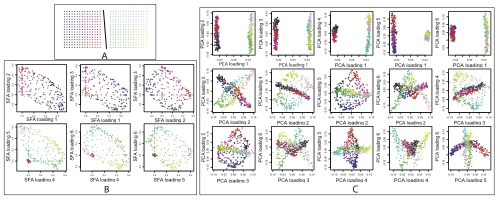
Figure 7. Results on simulated genotype data from a two independent 2-D habitats.
In Panel A, each dot represents a population colored according to habitat and location. Colors in Panels B and C indicate locations in Panel A. Panel B shows how SFA captures the structure with a six factor model. Loadings on the first three factors (first row of Panel B) correspond to location in the first habitat; individuals in the second habitat have essentially zero loading on these factors. Similarly, loadings on the other three factors (second row of Panel B) correspond to location in the second habitat. Panel C shows estimated loadings from PCA for the same data. Each plot shows one loading plotted against another. Although the PCA results clearly reflect the underlying structure one might struggle to infer the structure from visual inspection of these plots if the colors were unknown.

