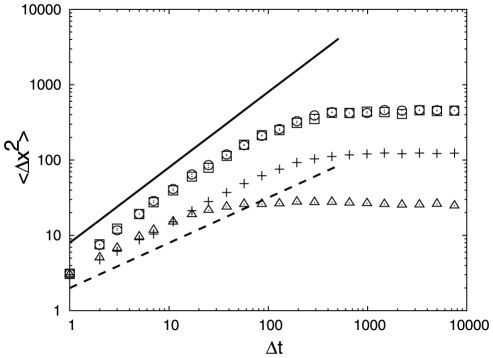
Figure 2. MSD for pieces of the trajectory starting from the corresponding transition states.
Pluses are for unoptimized  , squares are for optimized
  , triangles are for unoptimized
  , circles are for optimized
  . The solid line shows diffusive (
 ) and the dashed line sub-diffusive (
 ) MSD to guide the eye.

