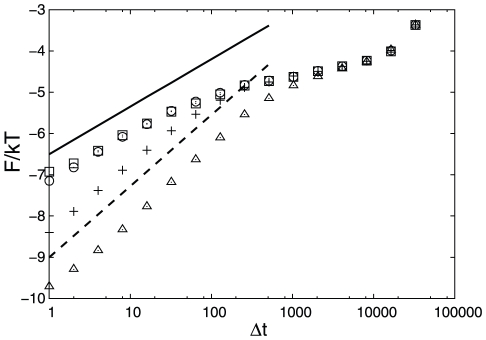
Figure 6. Scaling of  at the transition state with the sampling interval.
The sampling intervals are  .
.  of the TS are shown by symbols; notation as in Figure 2. The solid line shows the diffusive slope (
 ) and the dashed line shows the sub-diffusive slope (
 ) to guide the eye.

