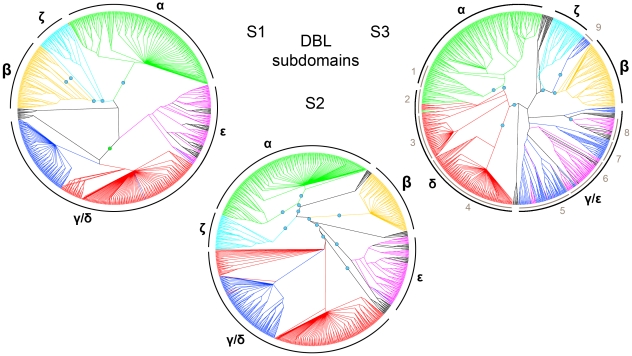
Figure 7. Evolutionary relatedness of DBL subdomain sequences.
A cladogram is shown for each of the three DBL subdomains S1–3, where boundaries for the subdomains were chosen at the edges of HB4 and HB2, as shown in Figure 6. Colors indicate major DBL domain classes estimated from alignment of the whole domains: Green: DBLα; Orange: DBLβ; Blue: DBLγ; Red: DBLδ; Magenta: DBLε; Cyan: DBLζ. VAR2CSA sequences are black. Blue dots indicate major bipartitions supported by at least 50% of 1000 bootstraps. The green dot in S1 marks a bipartition with bootsrap value 0.39. Subdomain clade correlation with whole domain classes is indicated around the trees in black; Clades were split if supported by 50% of the bootstraps.

