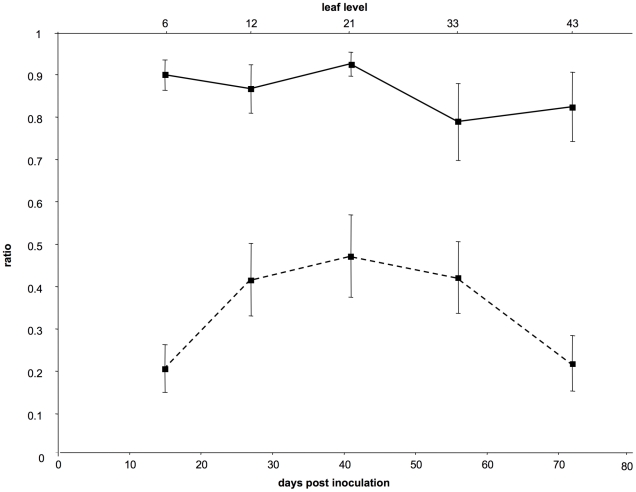
Figure 1. Dynamics of the frequency of VIT1 and of the proportion of cells infected by both variants.
The curves on the figure represent either the average values of the frequency of VIT1 (full line) or those of the proportion of cells infected by both variants (dotted line) in different leaf levels. Days post-inoculation are indicated below and the leaf level sampled at each time point is indicated above. Bars represent standard errors. A test using a linear mixed-effects model showed no significant differences between pairs of dates for the VIT1 frequency, and the slope of the linear regression of VIT1 relative frequency versus time did not significantly differ from 0. In contrast, the same analysis showed significant differences for the proportion of cells infected by both variants (P<0.001).

