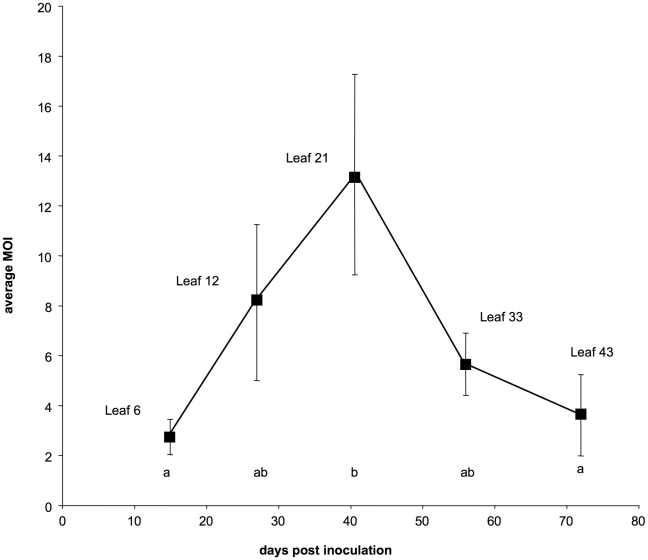
Figure 2. Dynamics of the multiplicity of cellular infection by Cauliflower mosaic virus in turnip plants.
Each point represents the average estimate of the MOI over 6 infected plants at the indicated leaf level. Bars represent standard errors. Different letters between two estimates indicate significant differences (P<0.05).

