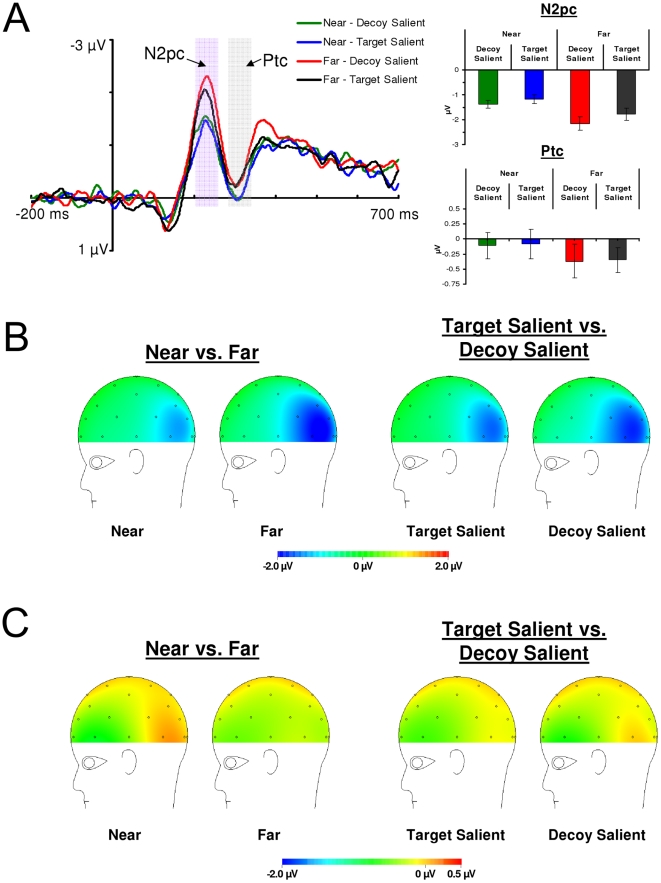
Figure 7. Difference waveforms and scalp distributions from Experiment 2.
(a) Left: Ipsilateral/contralateral difference waveforms at electrodes PO3/4 for Experiment 2. These were calculated by subtracting the ipsilateral waveforms from the contralteral waveforms plotted in Figure 6. These difference waveforms allow N2pc and Ptc amplitudes to be compared across levels of target-decoy separation and relative salience. Right: N2pc and Ptc amplitudes as a function of target-decoy separation and relative salience. Note that N2pc amplitude increases with increasing target-decoy separation and N2pc amplitude increases when the decoy is relatively more salient than the target. Ptc amplitude is more positive when the target and decoy are near each other and did not vary with the relative salience manipulation. Error bars are standard error. (b) Scalp distribution of the N2pc. (c) Scalp distribution of the Ptc.

