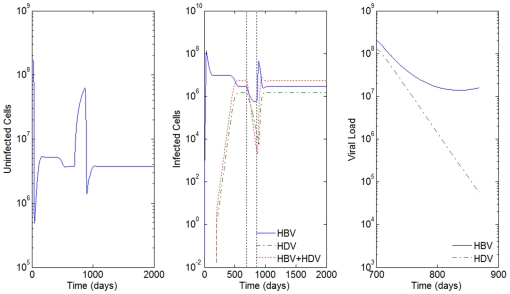
Figure 12. HBV and HDV viral dynamics during antiviral therapy.
Number of uninfected cells (left), infected cells (middle), and viral loads during the 168 days of antiviral therapy with IFN alone (right). Initial viral loads of 400 copies/mL, no inhibition of the HBV viral production in cells infected with HBV and HDV and  .
.

