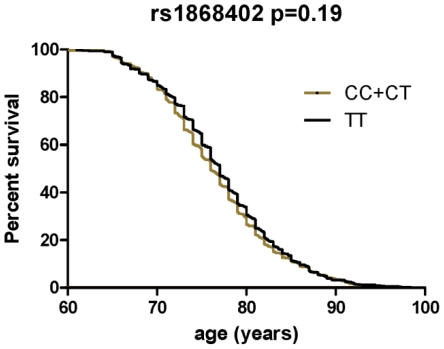
Figure 2. Survival curves comparing age at onset of LOAD between the different genotypes of rs1868402.
Survival fractions were calculated using the Kaplan-Meier method and significant differences were calculated by Log-rank test. Association with age at onset was calculated in a combined series with samples from WU-ADRC-CC, ADNI-CC and MRC.

