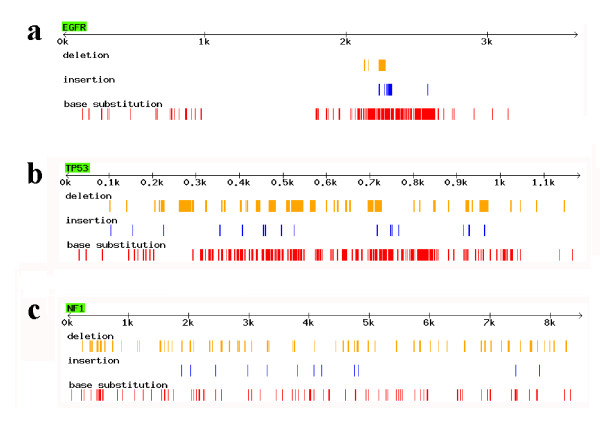
Figure 2.
Examples of the genes in 'apparent', 'significant', and 'insignificant' categories. (a) Mutational pattern in EGFR as an example of the 'apparent' category (for detailed definition, see Methods); (b) in TP53 as an example of the 'significant' category; (c) in NF1 as an example of the 'in significant' category. Gene names are shown in green boxes. The Arrow below the gene name denotes position in the CDS, and 'k' means 1000 bp length of DNA. To make indels as less overlap as possible, only ≤30 bp indels are shown.

