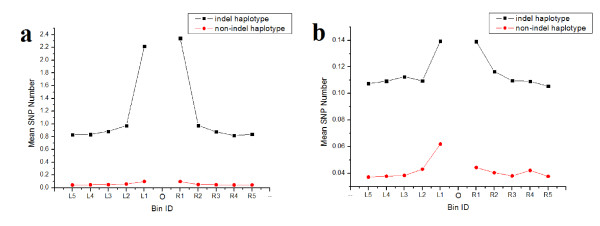
Figure 5.
Evolutionary analysis of SNP distribution in indel flanking regions in cancer genes. (a) SNP distribution pattern from the alignments of human-Celera, human-Ref, and chimpanzee sequences. (b) SNP distribution pattern from the alignments of human-Korean, human-Ref, and chimpanzee sequences. 'O' denotes indel's position. L1-L5 represents the five bins (100 bp each) in the 5' flanking region, and R1-R5 represents the five bins (100 bp each) in the 3' flanking region. 'Indel haplotype' denotes the SNPs shared with indel haplotype, and 'non-indel haplotype' denotes the SNPs which are not shared with indel haplotype.

