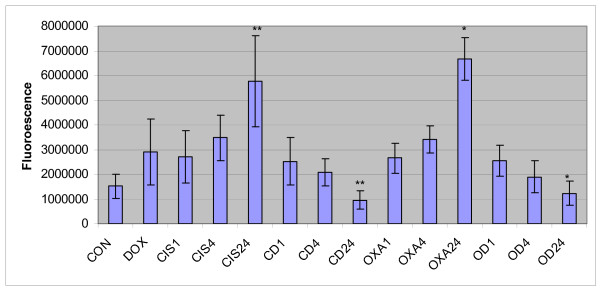
Figure 7.
Real time PCR for caspase 3 gene expression. This figure displays quantitative presentation of caspase 3 gene expression in HT 29 cells by real time PCR. (CON = control, DOX = doxycycline, CIS1; 4; 24 = Cisplatin treatment for 1, 4 and 24 hours respectively, CD1; 4; 24 = Cisplatin and Doxycycline treatment for 1, 4 and 24 hours respectively, OXA1; 4; 24 = Oxaliplatin treatment for 1, 4 and 24 hours respectively, OD1; 4; 24 = Oxaliplatin and Doxycycline treatment for 1, 4 and 24 hours respectively). Data are depicted as means of six experiments ± standard deviation. (* - Denotes statistically significant difference in the activity).

