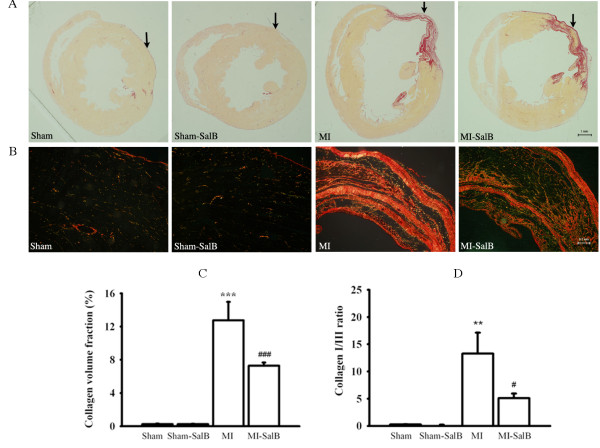
Figure 7.
SalB decreases fibrosis induced by MI. (A) Representative pictures of whole heart stained by Sirius red. The position of collagen deposition was stained in red.(B) Higher magnification (100X) of areas in Fig. 7A indicated by arrows using a polarized filter. The collagen I was demonstrated as red/yellow and collagen III was demonstrated as green. (C) Quantitative data of collagen volume fraction. (D) Quantitative data of the ratio of collagen I/III in infarct area. **P < 0.01, ***P < 0.001 versus Sham rats; #P < 0.05, ###P < 0.001 versus MI rats. n = 10 for every group.

