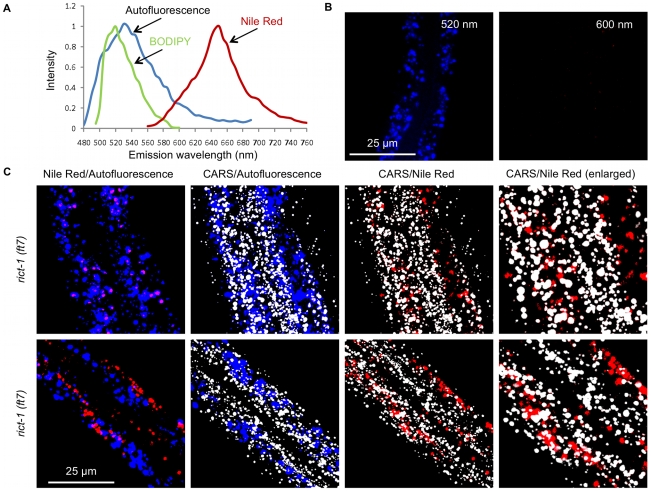
Figure 6. Possible errors in dye-labeled assays to analyze fat stores in living C. elegans.
(A) Emission spectra of autofluorescent granules, BODIPY, and Nile Red obtained with microspectrometry. The autofluorescent granules and BODIPY are excited at 457 nm using an Argon-Ion continuous-wave laser. The Nile Red is excited with a 543 nm Helium-Neon continuous-wave laser. (B) Insignificant bleed-through of autofluorescent granule signal is observed using a 600 nm bandpass filter and two-photon excitation at 885 nm. (C) CARS and TPEF imaging of two rict-1 worms fed with Nile Red. Autofluorescent granules (blue) are detected with a 520 nm bandpass filter and Nile Red (red) is detected with a 600 nm bandpass filter. Pink color is the result of overlapping blue and red colors which indicates co-localization of autofluorescent granules and Nile Red. Note the complete co-localization of autofluorescent granules and Nile Red in worm 1 (upper panels) and partial co-localization of autofluorescent granules and Nile Red in worm 2 (lower panels). Rightmost panels are enlargements of the CARS/Nile Red overlaid images with the xy dimensions of 20 µm×20 µm. Note the poor co-localization of lipid droplets (grey) and Nile Red (red). Images are presented as 3-D stacks of 30 frames taken at 1 µm increment along the vertical axis.

