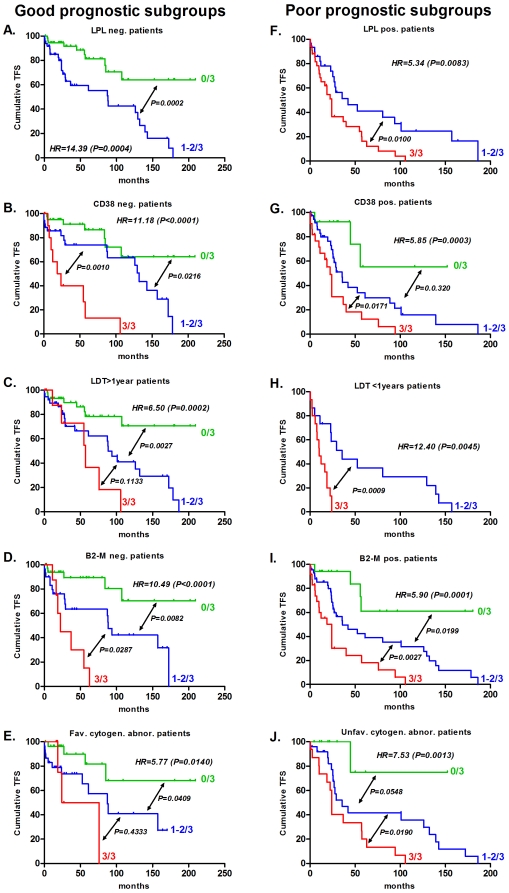
Figure 3. qPCR can fine tune prognosis in good or poor prognostic subgroups.
The qPCR score was applied to different subgroups (previously divided by other prognostic factors). TFS curves are shown for LPL (A, F), CD38 (B, G), LDT (C, H), β2-M (D, I), and cytogenetic abnormalities (E, J). The median TFS and patient numbers in the different groups are provided in Table 2. Groups of less than two patients are not represented in this figure.

