
Figure 1.
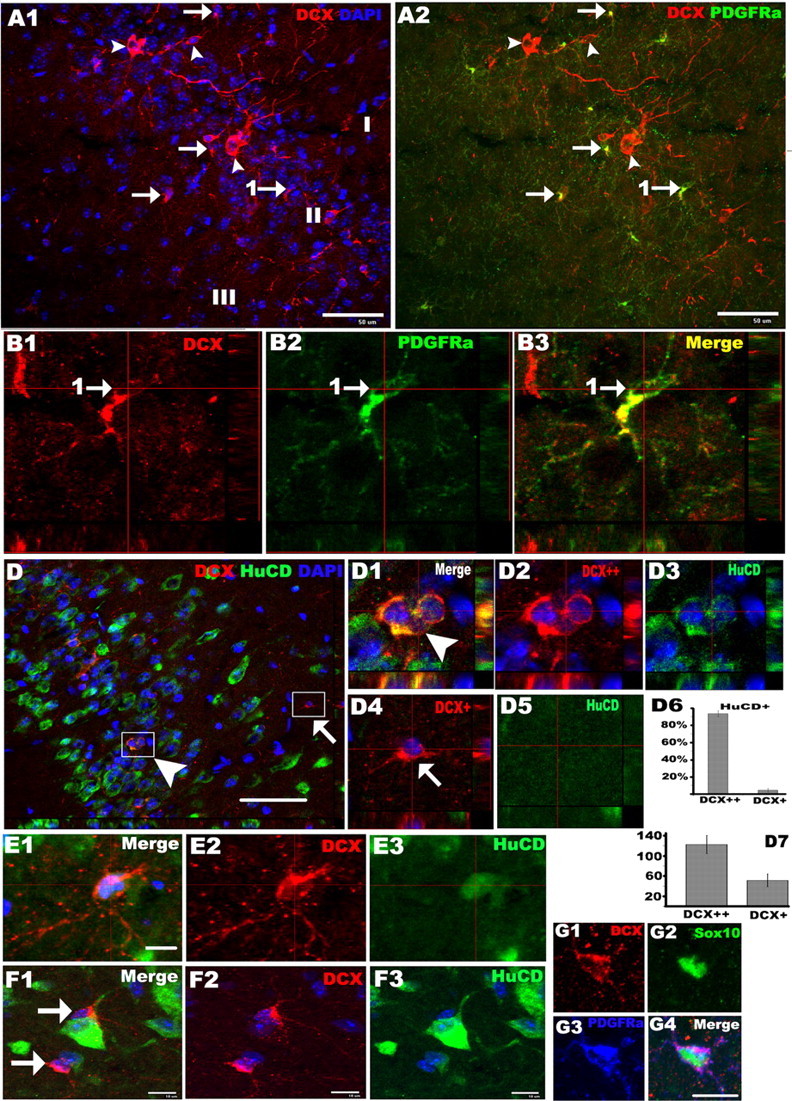
OPCs in the cortex express low-level doublecortin. Double immunohistochemistry depicting high-level DCX (red)-expressing (A1, A2, arrowheads) and low-level DCX (red)-expressing (A1, A2, arrows) cells in the piriform cortex. Low-level DCX-expressing cells were colabeled with PDGFRα (green) (arrows in A2, B1–B3) and were negative for HuCD (green) (D4, D5), and high-level DCX-expressing cells colocalized with HuCD (green) (D1–D3). B1–B3, Orthogonal views of the cell pointed by arrow 1 in A2. D1–D3 and D4,D5 showed orthogonal views of boxed areas pointed by arrowhead an arrow in D, respectively. D6, Percentage of high-level (DCX++) and low-level (DCX+) DCX-expressing cells that were positive for HuCD. D7, Data showing DCX protein expression levels by DCX++ and DCX+ cells. E1–E3, DCX (red)/HuCD (green) double-positive cells with morphology like that of OPCs. F1–F3, Low-level DCX (red)-expressing cells (arrows) located close to HuCD+ (green) neurons. G1–G4, DCX+ (red)/PDGFRα+ (blue) cells were colabeled with Sox10 (green). I, II, and III in A1 stand for layer I, II, and III of piriform cortex, respectively, in this and subsequent figures. All the pictures were taken from P45–P60 mice. Scale bars: A1, A2, D, 50 μm; E1, F1, G4, 10 μm.