
Figure 3.
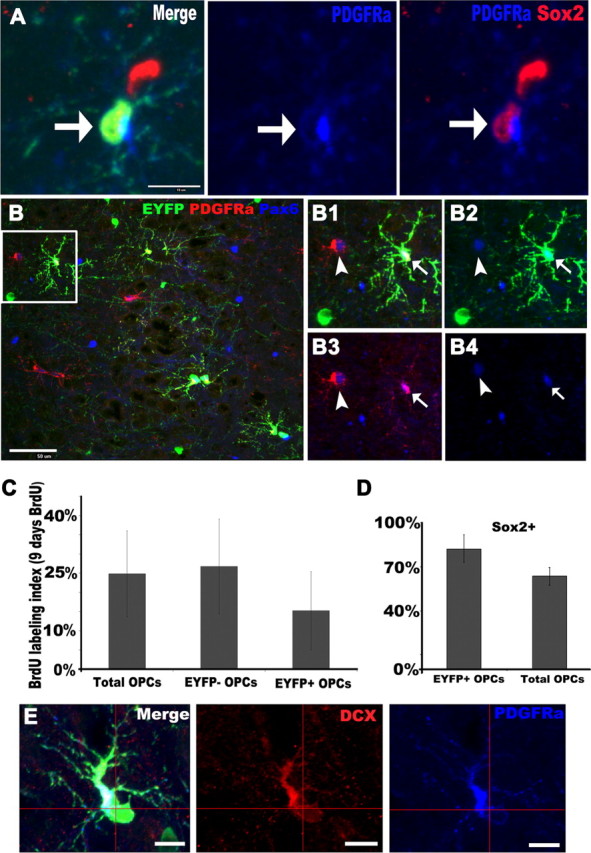
Phenotypic features of EYFP+ OPCs. A, Fluorescent micrographs depicting EYFP+ (green)/PDGFRα+ (blue) putative OPCs expressing the neural stem cell marker Sox2 (red). B, Triple staining for EYFP, PDGFRα (red), and Pax6 (blue) showing Pax6 expression in OPCs. The boxed area in B is shown at higher magnification in B1–B4. Both PDGFRα+ (arrowheads in B1–B4) and PDGFRα+/EYFP+ (arrows in B1–B4) displayed nuclear Pax6 immunoreactivity. C, BrdU labeling index in total OPCs, EYFP− OPCs, and EYFP+ OPCs, respectively, after 9 d BrdU administration in drinking water starting on P45. Note that the labeling index of EYFP+ OPCs was ∼10% lower than that of EYFP− OPCs. D, Percentages of EYFP+ OPCs and total OPCs that were Sox2+, respectively. E, EYFP+/ PDGFRα+ (blue) putative OPCs expressed DCX (red). Scale bars, 10 μm.