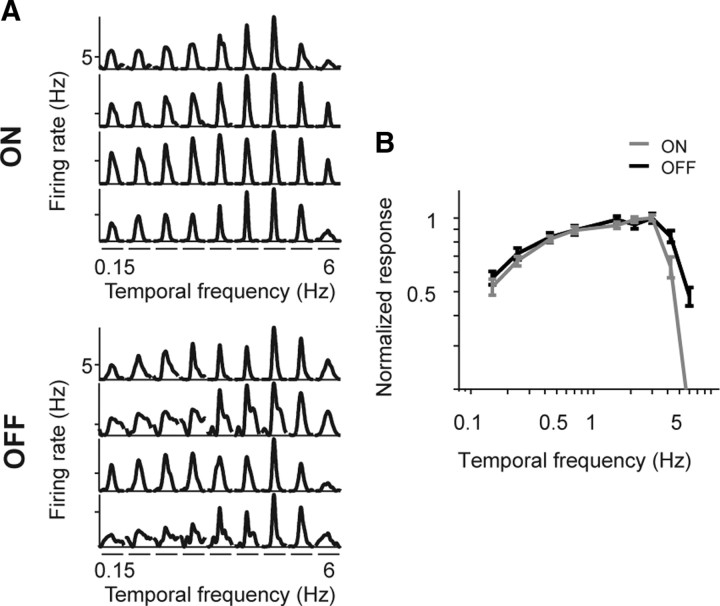
Figure 1.
ON and OFF cells show similar temporal frequency tuning in response to sine wave gratings under photopic conditions. A, Representative responses for four ON and four OFF ganglion cells to drifting sine wave gratings of increasing temporal frequency. Each segment of the traces shows the average firing rate over one period of the drifting grating for a given frequency. B, Average tuning curves (mean ± SEM) for all ON and OFF cells, normalized to the peak (n = 20 ON cells, 31 OFF cells). Temporal tuning curves were calculated by Fourier analyzing the responses and extracting the amplitude of the first harmonic response at each frequency. ON and OFF cells respond to a similar range of temporal frequencies (p > 0.05, Student's t test, comparing the mean center of mass of the ON cell tuning curves with that of the OFF cells).

