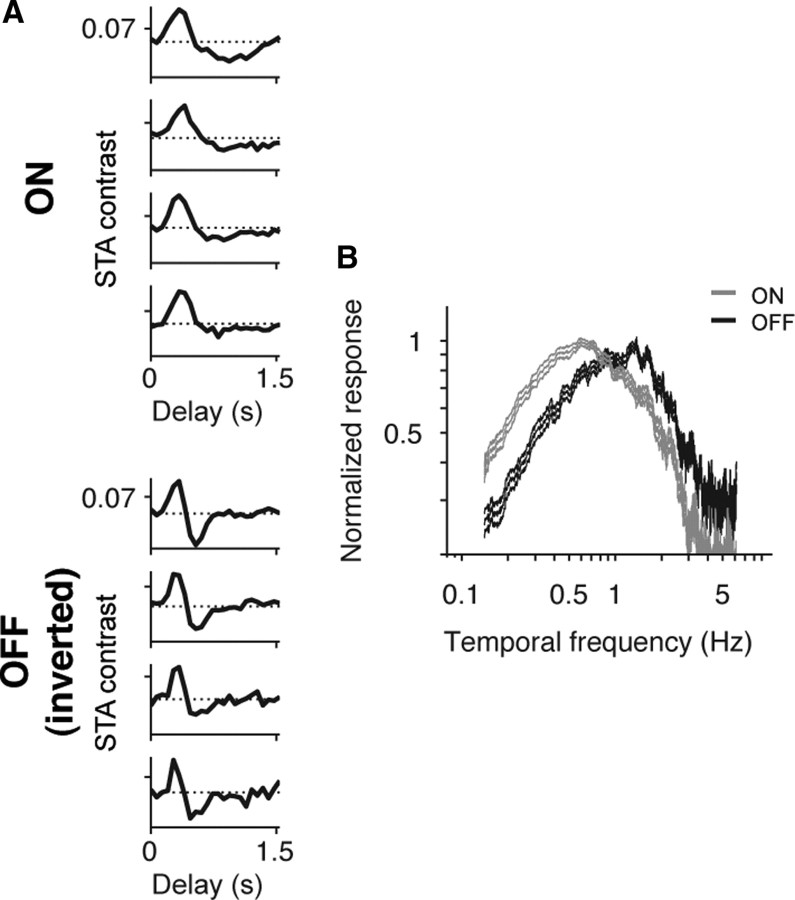
Figure 4.
The divergence under scotopic conditions was also observed for the white noise stimulus. A, Representative STA time courses for four ON and four OFF ganglion cells in response to a white noise (random checkerboard) stimulus. B, Average temporal frequency responses (mean ± SEM), normalized to the peak (n = 20 ON cells, n = 31 OFF cells). As with the grating stimulus, the ON cells shifted to low frequencies, whereas the OFF cells continued to respond to high frequencies (p < 10−3, Student's t test, comparing the mean center of mass the two populations).

