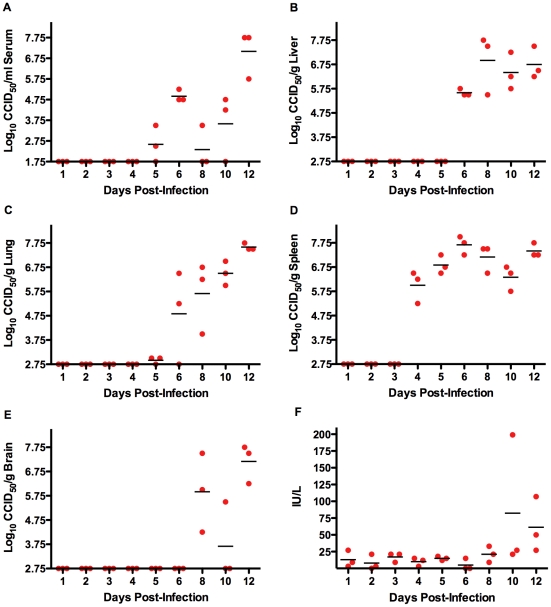
Figure 3. Time course analysis of tissue TCRV titers and ALT levels in AG129 mice.
Groups of 3 animals were sacrificed on the specified days during infection for analysis of A) serum, B) liver, C) lung, D) spleen, and E) brain virus titers, and F) serum ALT concentration. The day-12 group started with 6 animals, with 3 succumbing prior to time of sacrifice.

