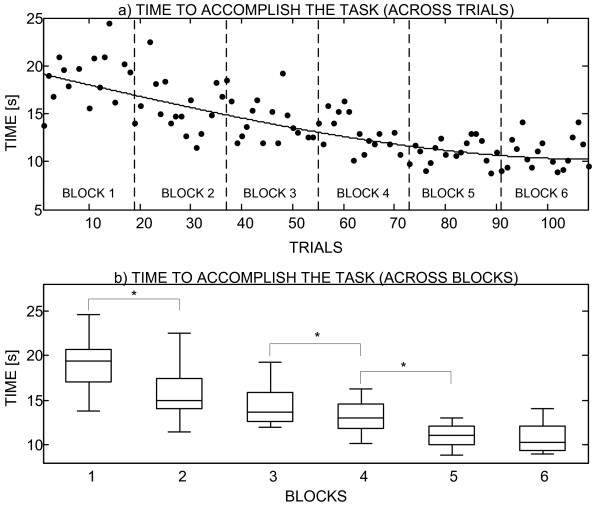
Figure 10.
Improvements in performance due to learning. The figure shows the results (time spent to accomplish the task) organized as a) individual trials and b) blocks of trails. The vertical axis is the time needed to accomplish the task. In plot a), the trend obtained by fitting a cubic polynomial through the experimental results (black dots) is shown by a continuous line, and the boundaries between the blocks of trials are depicted by the dashed vertical lines. In plot b), the horizontal lines are the medians, boxes show inter-quartile ranges and whiskers are minimal and maximal values. Statistically significant difference is denoted by a star. The time needed to successfully accomplish the task decreases steadily during the experiment.

