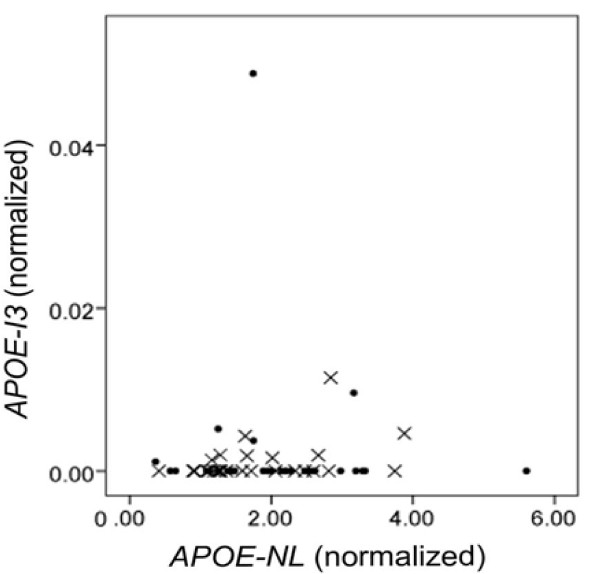
Figure 2.
Quantification of APOE-I3 and APOE-NL Expression. Expression of APOE-I3 is shown as a function of APOE-NL in AD (X markers) and non-AD (circle markers) samples. Specimen #31 is the non-AD outlier with a high level of APOE-I3 expression. RT-qPCR data were normalized to the geometric mean of hypoxanthine-guanine phosphoribosyltransferase and ribosomal protein L32. There was no correlation of APOE-I3 or APOE-NL with APOE3 versus APOE4 genotype, or AD status (data not shown).

