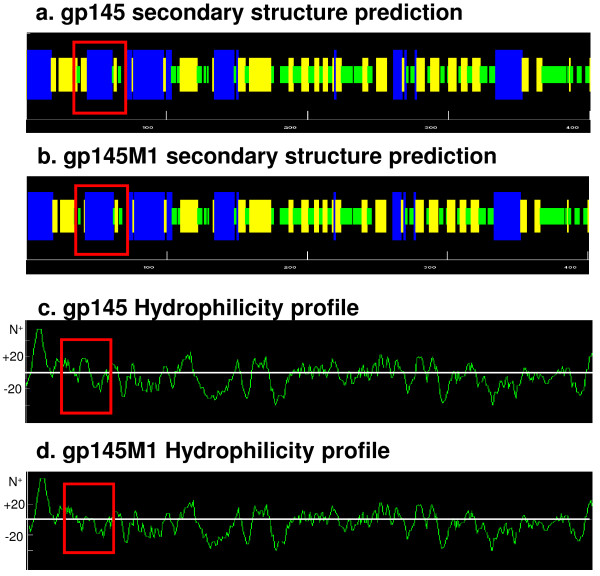
Figure 7.
The secondary structure prediction and hydrophilicity changes of antigens. AnthePro5.0 software was applied to predict the secondary structure and hydrophilicity changes of gp145 and gp145M1. The red rectangle labels the changed profiles. a & b) The secondary structure predictions of gp145 and gp145M1. α-helix in blue bar; β-sheet in orange bar; β-turn in green bar; others in black bar. c & d) The difference in hydrophilicity between gp145 and gp145M1. The Y-axis shows the value of predicted hydrophilicity.

