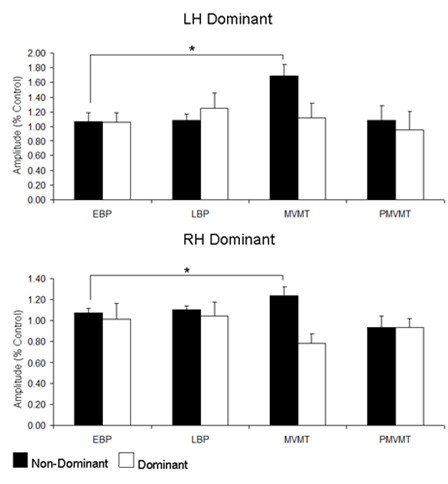
Figure 2.

Group Average N30 amplitudes. Group average (n = 8) bar graphs for left hand dominant (top) and right hand dominant (bottom) groups for each of the timing epochs. Early Bereitschaftspotential (EBP); Late Bereitschaftspotential (LBP); Movement (MVMT); Post-Movement (PMVMT). White bars indicate movement performed with the dominant hand. Black bars indicate movement performed with the non-dominant hand. Values are expressed relative to control values. Error bars are ± SEM. * denotes significance p < 0.05.
