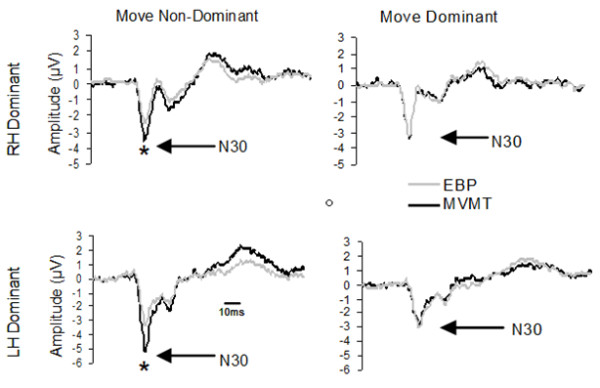
Figure 3.

Group Average FCZ traces. Group average (n = 8) traces recorded from electrode site FCZ. Top row traces recorded from right hand (RH) dominant group; Bottom row traces recorded from left hand (LH) Dominant group. Left column represents movement performed with the non-dominant hand, right column movement performed with the dominant hand. Light trace a result of median nerve stimulations that fell within the Early Bereitschaftspotential (EBP) epoch; dark trace a result of median nerve stimulations that fell within the Movement epoch (MVMT). * denotes significance p < 0.05.
