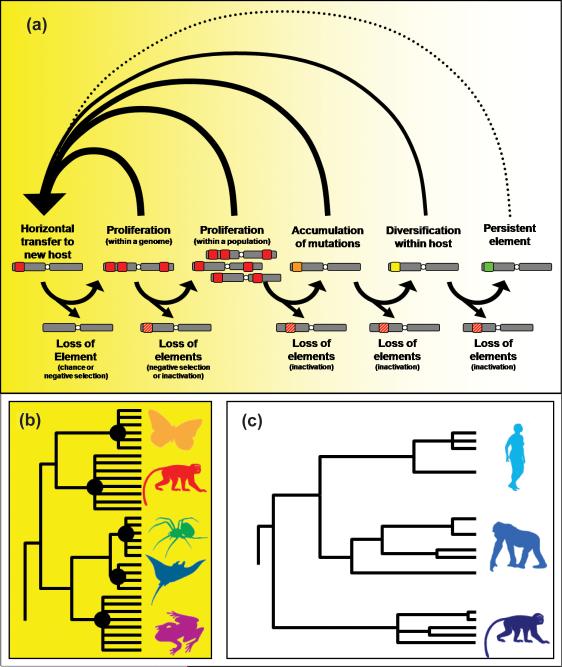
Figure I. (a) Simplified model of the lifecycle of TE families and the importance of horizontal transfer.
Grey bars represent chromosomes, colored squares represent TEs (with the original sequence in red, mutated in orange, diversified in yellow, persistent in green, and inactivated by orange and red lines). Arrows represent transitions between stages (not all possibilities are illustrated). (b and c) Expected phylogenetic patterns of TEs found among hosts when HTT is frequent (b) versus rare (c). Hypothetical TE phylogenies are depicted with black lines, black circles at nodes illustrate episodes of HTT, and host species are shown in colored silhouettes on the right of each tree with color similarity indicative of their phylogenetic relatedness.

