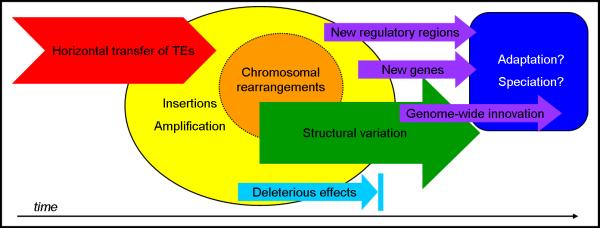
Figure I. Schematic of the impact of HTT on the genome.
Red chevron represents HTT, yellow and orange circles represent proximate physical effects of HTT, colored arrows represent consequences (purple = beneficial, green = neutral, and light blue = deleterious), and the rectangle represents potential downstream outcomes of effects for which there is a selective benefit.

