Figure 2.
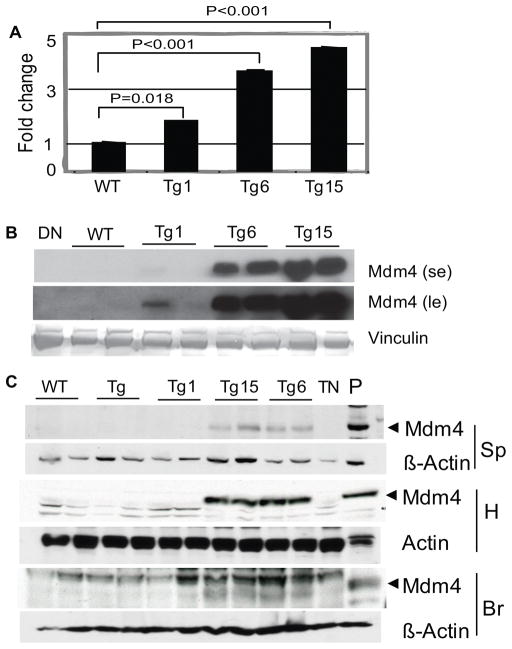
Mdm4 overexpression in mouse tissues of different transgenic lines. (A) Mdm4 mRNA levels in MEFs from Mdm4Tg1, Mdm4Tg6 and Mdm4Tg15 lines were determined by RT-q PCR and plotted as fold change compared to Gapdh with wild type (WT) control set to 1. Three different MEF lines were analyzed for each genotype (p values were calculated by student t-test). (B) Mdm4 protein levels in MEFs from different lines were assayed by western blotting. se, short exposure; le, long exposure.(C) Western blots from various tissues of 2-month-old transgenic Mdm4Tg, Mdm4Tg1, Mdm4Tg6, and Mdm4Tg15 mice using an Mdm4 antibody. β-Actin antibodies were used to determine equal loading of the same blot except for heart (H) as that blot was run longer to eliminate overlap with a non-specific band. Sp, Spleen; Br, Brain; DN, protein lysate from double null (Mdm4−/− p53−/−) cells ; TN, protein lysate from triple null (Mdm2−/− Mdm4−/− p53−/−) cells; P: protein lysate from Mdm4Tg6 MEFs as positive control.

