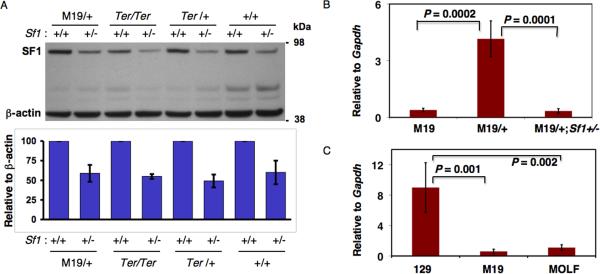
Fig.3. Variation of Sf1 levels in different mouse strains.
(A) (top) SF1 levels in Sf1 deficient mice. PN1 testes, from M19/+, Ter/Ter, Ter/+ and wild-type (+/+) mice and corresponding Sf1 deficient (Sf1: +/-) mice, were used for immunoblotting using anti-SF1 antibody. The blots were re-probed with anti-β-actin as controls. (bottom) Quantitation of SF1 levels in the mouse strains. The results are the average from 2 experiments. (B) qRT-PCR was used to determine Sf1 levels in PN 1 testes of M19, M19/+ and M19/+;Sf1+/- strains. (C) Comparing Sf1 levels in 129, M19 and MOLF strains. Total RNA from PN1 testes was used. The expression levels are normalized against Gapdh expression in the same sample. Error bar is the standard deviation derived from two independent experiments.

