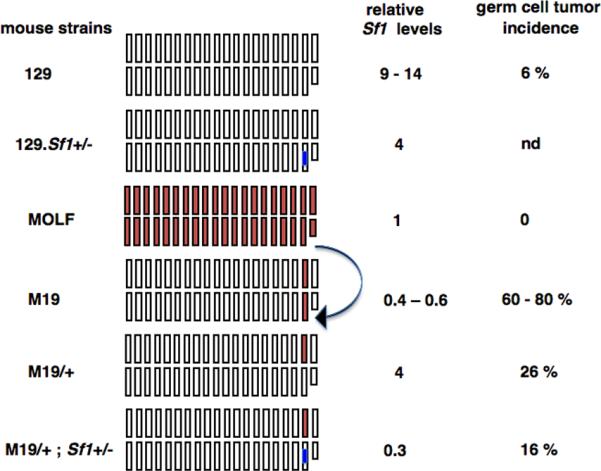
Fig.4. Comparing Sf1 levels and germ cell tumor incidences of different mouse strains.

The boxes represent the 19 autosomal Chrs and Chr X and Y (smaller box) of the mouse strains. White boxes represent 129 chromosomes. MOLF chromosomes are in red. The Sf1β-geo allele is represented by the blue mark on Chr 19. M19 strain carries Chr 19 of MOLF (indicated by arrow) and all other chromosomes are of 129 origin. Therefore, Sf1 levels of M19 are similar to that in MOLF although tumor incidences of the two strains differ. M19/+ is heterozygous for MOLF Chr 19 and has higher levels of Sf1. Introduction of Sf1β-geo allele to generate M19/+;Sf1+/- mice results in lowering of Sf1 levels and concomitant reduction of tumors compared to that in M19/+. The relative Sf1 levels are the median values from the graphs in Figs.1 and 3.
