Figure 1.
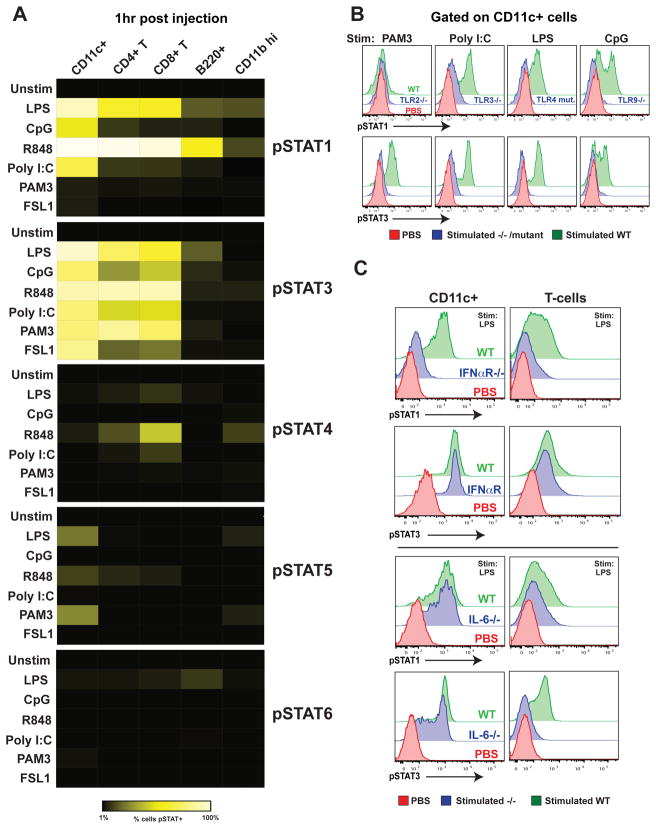
Early in vivo response to TLR ligands is characterized by ligand-specific Type I IFN and IL-6 dependent pSTAT1 and pSTAT3 activation in multiple cell types.
(A) Relative response to various TLR ligands in different cells as determined by levels of STAT phosphorylation. The indicated natural and synthetic microbial ligands specific for TLR4 (LPS), TLR9 (CpG), TLR7 (R848), TLR3 (poly I:C), TLR1/2 (PAM3CSK4), TLR2/6 (FSL1), and phosphate-buffered saline (PBS) controls were intravenously injected into C57BL/6 mice (20 μg/mouse). One hour after injection, spleens were harvested and immediately fixed and prepared for surface marker and pSTAT 1, 3, 4, 5, and 6 staining. Cell populations were identified as CD11c+ B220− (cDCs); CD4+ T cells; CD8+ T cells; B220+ CD11c− (B cell), or CD11bhi (granulocytes). The percentage of cells showing greater than basal STAT phosphorylation is shown as a heat map (black, 0%; bright yellow, 100%).
(B) STAT1 and 3 phosphorylation is TLR dependent. Wild-type (green) or TLR2−/−, TLR3−/−, TLR4 mutant, and TLR9−/− mice (all in blue) were challenged with PAM3CSK4, poly (I:C), LPS, and CpG, respectively. Control PBS treatment is shown in red. Spleens were prepared for intracellular staining after 1 hour. Levels of pSTAT1 and pSTAT3 in CD11c+ cells are shown.
(C) STAT1 and STAT3 phosphorylation are type I IFN and IL-6 dependent respectively. IFNAR−/− and IL6−/− mice were injected with 20 μg LPS; 1 hour later cells were harvested and prepared as before. All experiments were performed in at least three separate mice; data from one representative experiment is shown.

