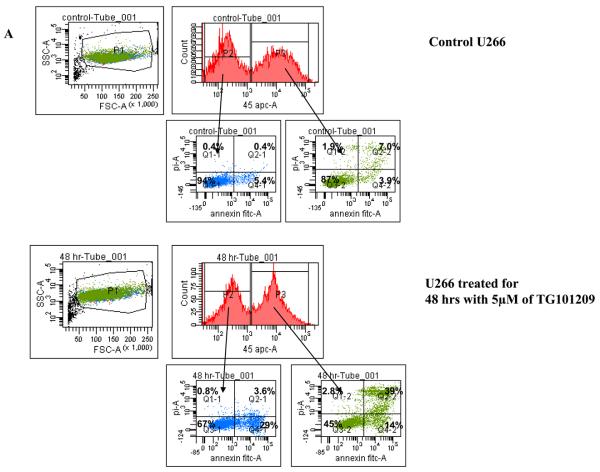
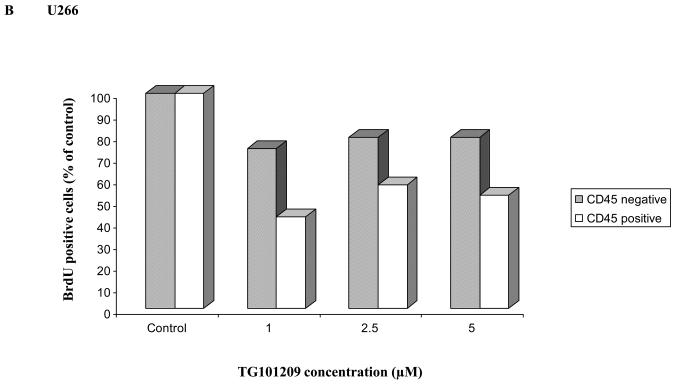
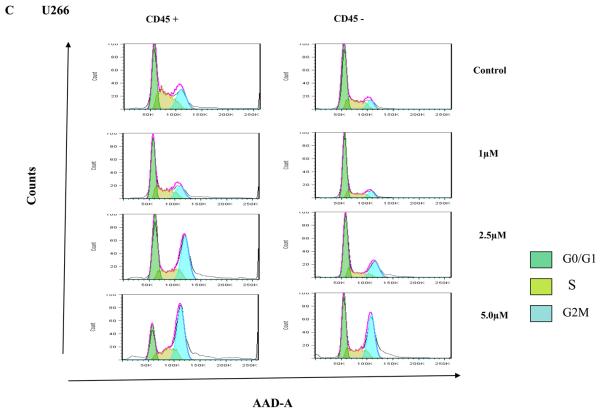
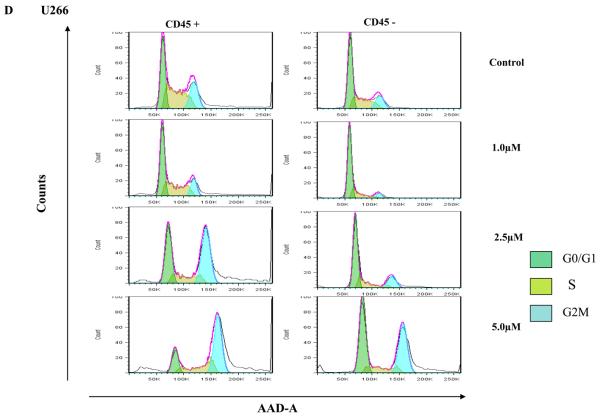
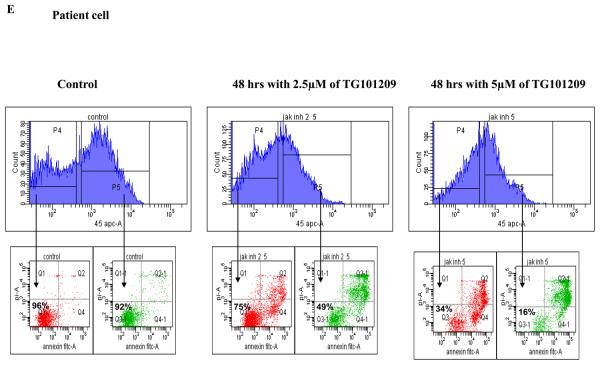
Figure 4. Preferential killing of CD45+ cells by TG101209.
A) We incubated U266 cells with 5μM of TG101209 for 48 hours. At the end of the incubation cells were harvested, washed one time in annexin binding buffer (ABB) and incubated with annexin FITC and CD45 APC. We monitored for drug induced apoptosis in CD45+ and CD45− populations. The panel on top within each group (control and drug incubated samples) indicates the gating done to discriminate between CD45+ and CD45− populations. The bottom panel indicates the apoptosis in cells selected based on CD45 expression. In the Annexin V-FITC staining is represented on the X-axis and propidium iodide (PI) staining is represented on the Y-axis. Percent cells in viable quadrant are indicated. B) U266 cells were incubated with 1, 2.5 or 5μM of TG101209 for 24 hrs. Post incubation, cells were harvested, washed one time in staining buffer (SB) and re suspended in 1 ml of culture media plus 10μl of BRDU. Cells positive for BRDU indicate the proliferative fraction. As shown in B), proliferation of CD45+ population is inhibited by 50% while proliferation of CD45− population is inhibited by only 20% after 24 hours of drug treatment. TG101209 concentration is indicated on the X-axis and cells positive for BRDU (% of control) is indicated on the Y-axis. U266 cells were incubated with 1, 2.5 or 5μM of TG101209 for C) 24 or D) 48 hrs. Post incubation, cells were treated with AAD and cell cycle arrest measured. E) We incubated CD138+ cells from bone marrow of patients with 2.5μM or 5μM of TG101209 for 48 hours. At the end of the incubation, cells were harvested, washed one time in annexin binding buffer (ABB) and incubated with annexin FITC and CD45 APC. We monitored for drug induced apoptosis in CD45+ and CD45− populations. The panel on top within each group (control and drug incubated samples) indicates the gating done to discriminate between CD45+ and CD45− populations. The bottom panel indicates the apoptosis in cells selected based on CD45 expression. In the Annexin V-FITC staining is represented on the X-axis and propidium iodide (PI) staining is represented on the Y-axis. Percent cells in viable quadrant are indicated.

