
Figure 3.
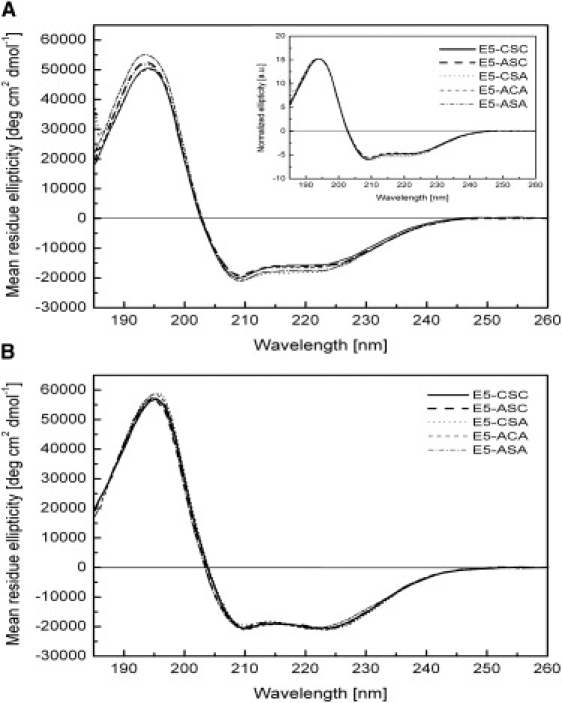
CD spectra of E5-CSC and mutants in detergent micelles and liposomes. (A) Aqueous solution of 10 mM LPPC micelles at 20°C, showing a predominantly α-helical conformation of the proteins. (Inset) Measured CD spectra normalized to the maximum ellipticity at 194 nm. (B) DMPC/LMPC vesicle suspensions (pH 3) with a protein/lipid ratio of 1:300 (mol/mol) measured above the lipid phase transition at 30°C.