
Figure 3.
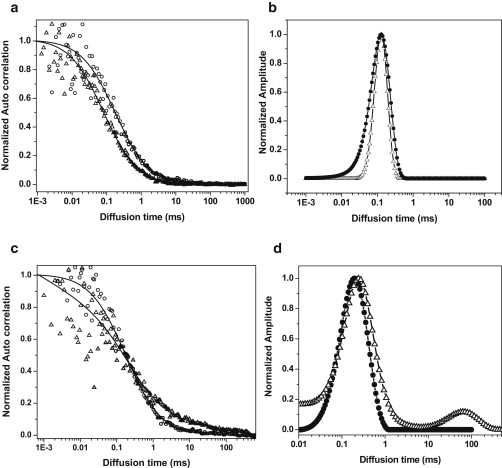
Fluorescence autocorrelation of Aβ on cell membranes. (a) Fluorescence autocorrelation traces obtained from the extracellular solution containing 150 nM Aβ (circles) and 350 nM Aβ (triangles). (b) Corresponding diffusion-time distributions obtained by fitting the data with the MEMFCS algorithm. (c) Fluorescence autocorrelation curves obtained from the cell membrane for 150 nM Aβ (circle) and 350 nM (triangles) Aβ concentrations. (d) Diffusion-time distribution obtained from fitting the data in c.