
Figure 2.
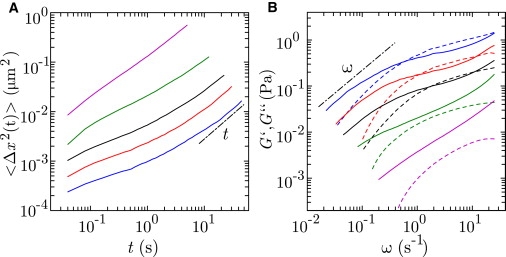
(A) Mean-square displacement 〈Δx2〉 versus time t in reaction buffer including 1.0 mM ATP at 310 K. The concentrations are 1.4 (blue), 1.0 (red), 0.7 (black), 0.4 (green), and 0.2 (magenta) g of DNA/L. (B) Elastic storage G′ (dashed) and viscous loss G″ (solid) moduli versus frequency ω. (Dashed-dotted lines in A and B) Scaling laws for the diffusive 〈Δx2〉 ∝ t and low shear G″ ∝ ω limits for long times and low frequencies, respectively.