
Figure 3.
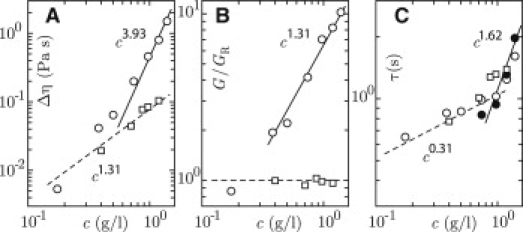
(A) Low shear viscosity increment Δη versus DNA concentration c. (B) High-frequency elasticity modulus divided by the Rouse modulus G/GR versus c. (C) Relaxation time τ versus c. (Open circles) Derived from Δη and G; (solid circles) ωc−1. (For panels A, B, and C: circles refer to solutions without enzyme, squares denote results obtained in the condition of full relaxation of entanglements, and dashed and solid lines represent scaling laws for nonentangled and entangled dynamics, respectively.)