
Figure 6.
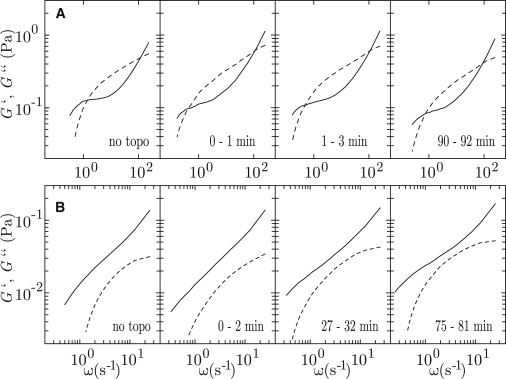
(A) Time evolution of the elastic storage G′ (dashed curves) and viscous loss G″ (solid curves) moduli after the addition of topoisomerase II (4 units/μg) to a solution of 1.0 g of DNA/L with an AMP-PNP concentration of 2.5 mM. (B) As in panel A, but for a nonentangled solution of 0.4 g of DNA/L.