
Figure 3.
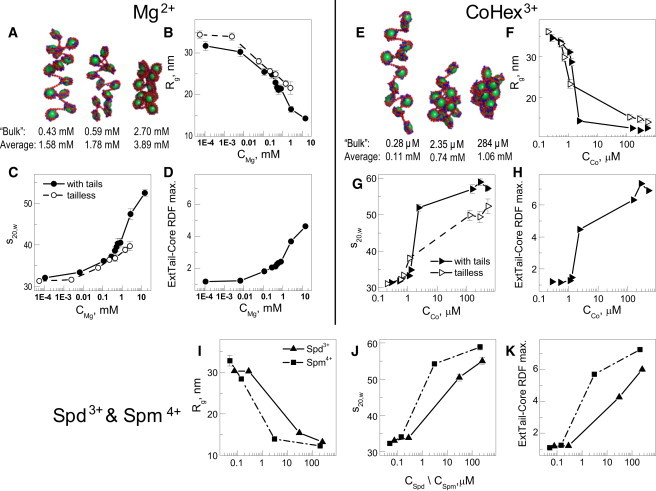
Summary of MD simulation results for the 12-177 array titration by Mg2+ (A–D), CoHex3+ (E–H), and Spd3+ and Spm4+ (I and K). (A and E) Representative snapshots illustrating folding of the array at different stages of titration by (A) Mg2+ and (E) CoHex3+; numbers under the snapshots indicate the concentration of the bulk (first line) and average (second line) Mg2+ or CoHex3+ concentration. (B, F, and I) Radius of gyration, Rg; (C, G, and J) sedimentation coefficient, s20,w; (D, H, and K) intensity of the maximum in the external tail-core RDF. In graphs B–D and F–H, data for the array with charged tails are drawn as solid circles and lines; similar results for the tailless array are shown as hollow points with dashed lines. In graphs B–D and F–K, the x axis is the bulk concentration of Mg2+ (B–D, CMg), CoHex3+ (F–H, CCo), and Spd3+ or Spm4+ (I and K, CSpd/CSpm). Numerical values (s20,w, Rg) and their dependencies on the average concentration of the oligocation are given in Table S5, Fig. S8, and Fig. S9.