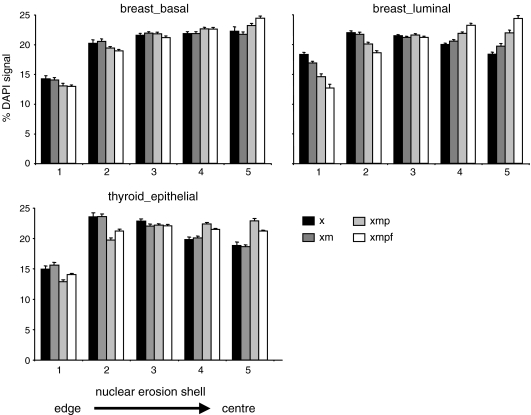
Fig. 4.
Changes in the distribution of chromatin at the nuclear periphery during tissue processing. Histograms showing the mean (± SEM) percent of DAPI staining in each of five shells of equal area, eroded from the edge (shell 1) to the centre (shell 5) of the nucleus for; top row—basal (left) and luminal (right) breast epithelial cells, bottom row—thyroid epithelial cells, in tissue sections treated with xylene only (x, black bars), xylene + microwave (xm, dark grey bars), xylene + microwave + pepsin (xmp, light grey bars) and treated as for FISH (xmpf, white bars). n > 21

