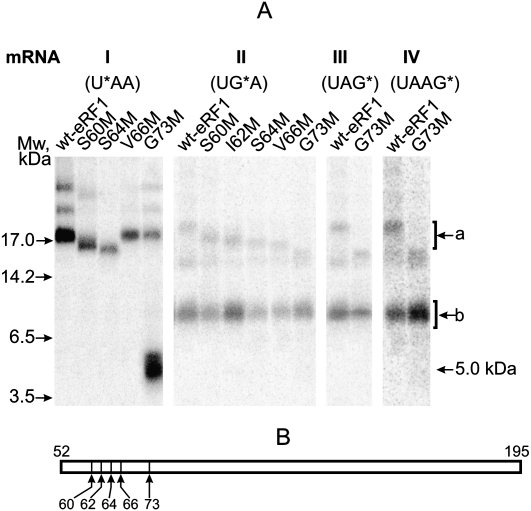
FIGURE 4.
Mapping of the cross-linking site within the 60–73 region using eRF1 mutants. (A) Patterns of CNBr-induced cleavage fragments obtained with S60M, I62M, S64M, V66M, and G73M mutants cross-linked to mRNA analogs. Positions of bands corresponding to molecular mass markers are given on the left. (Upper bands) a; (lower bands) b. Bands above a are most likely products of incomplete CNBr-induced cleavage of cross-linked eRF1 by analogy with the results obtained with wt-eRF1 (Fig. 3); the identity of the minor band between a and b whose intensity varied from experiment to experiment is unknown. (B) Schematic representation of the cleavage sites of a 52–195 fragment corresponding to a band for the cross-linked wt-eRF1.

