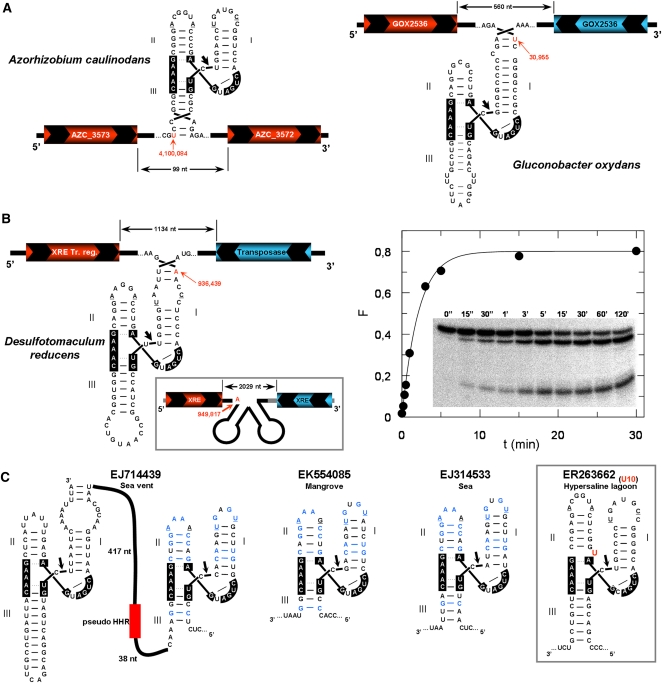
FIGURE 2.
Bacterial genomic data showing the presence of HHRs. (A) The HHR motifs obtained in the plant-associated bacteria Azorhizobium caulinodans, (left) and Gluconobacter oxydans (right). Positions of the ribozymes within each genome are shown in red with an arrow. The hypothetical ORFs coded in the sense and antisense strands are shown in red and blue, respectively. Nucleotides involved in the conserved loop–loop interaction are underlined. (B) The HHR motifs detected within the genome of the Desulfotomaculum reducens bacteria. Kinetic analysis of the in vitro self-cleavage capabilities of this ribozyme is shown at the right. (C) Some examples of HHR motifs detected from the Global Ocean metagenomics project (Rusch et al. 2007). A case showing a U insertion at the HHR catalytic core is shown in the right inset.

