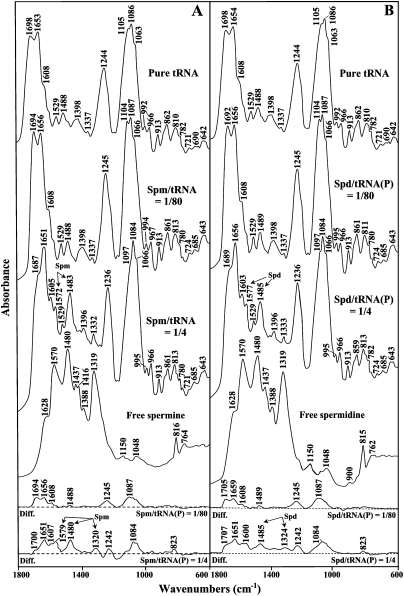
FIGURE 1.
FTIR spectra in the region of 1800–600 cm−1 for pure tRNA, free polyamine, spermine–tRNA (A), and spermidine–tRNA (B) adducts in aqueous solution at pH 7.0 ± 0.2 (top three spectra) and difference spectra for polyamine–tRNA adducts obtained at various polyamine/tRNA(P) molar ratios (bottom two spectra).

