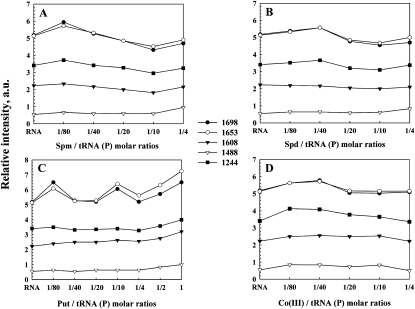
FIGURE 3.
Relative intensity variations in arbitrary units for several tRNA in-plane vibrations as a function of polyamine concentration. (A–D) Relative intensity for the tRNA bands at 1698 (guanine), 1653 (uracil), 1608 (adenine), 1488 (cytosine), and 1244 cm−1 (PO2−) for spermine, spermidine, putrescine, and cobalt(II1I)hexamine, respectively.

