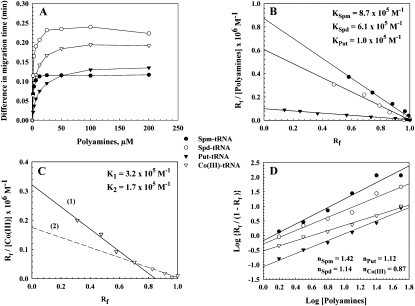
FIGURE 4.
(A) Plot of the difference in migration time (in minutes) of polyamine–tRNA complexes from capillary electrophoresis following incubation of a constant concentration of tRNA (1.25 mM) with various concentrations of polyamines. The difference in migration time of the polyamine–tRNA complexes was determined by subtracting the migration time of pure tRNA from that of each polyamine–tRNA adducts. (B,C) Scatchard plots for biogenic polyamine–tRNA, and cobalt(III)hexamine–tRNA complexes, respectively. (D) Hill plots for polyamine–tRNA complexes.

