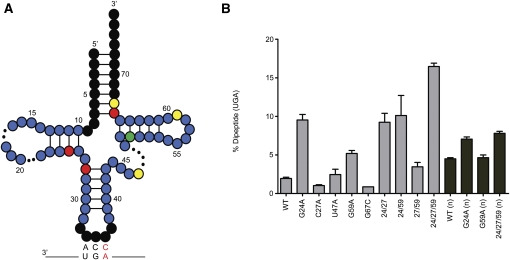
FIGURE 3.
Characterization of potent miscoding variants isolated by in vitro selection. The mutation frequency map (A) shows the frequency of mutation in fifty (n = 50) sequenced clones from pool 6. Nucleotides in black were not mutagenized in the experimental design. Colored nucleotides have a mutation frequency between 0% and 15% (blue), 15% and 25% (green), 25% and 49% (yellow), and >50% (red). (B) T7 transcribed tRNAs and the purified native (n) molecules were evaluated to determine the amount dipeptide formed on near-cognate (UGA)–programmed ribosome complexes after a 1-min incubation. The T7 transcripts (light gray) were assayed in HiFi buffer supplemented to 7 mM MgCl2 and the native tRNAs (dark gray) in HiFi buffer.

