FIGURE 4.
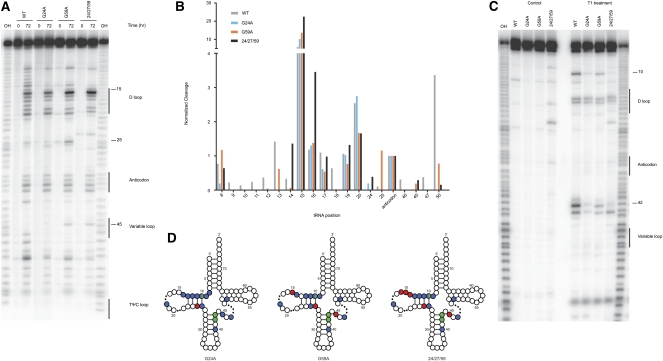
Structural analysis of variant tRNAs. (A) Ten percent PAGE in-line probing analysis where the indicated variant tRNAs were either incubated for 0 or 72 h at 25°C. Numbers highlight positions of interest in the cleavage pattern. Product identity was determined by comparison to a hydroxyl-mediated cleavage ladder (OH). (B) Quantitation of selected positions was performed using ImageQuant where the intensity of a band was normalized over the entire lane to account for loading differences and then normalized to cleavage at the same position (position 34 of the anticodon) for all variants tested. (C) Ten percent PAGE of T1 protection assay where the indicated variant tRNAs were either incubated with or without T1 nuclease. Numbers highlight positions of interest in the cleavage pattern. Product identity was determined by comparison to a hydroxyl-mediated cleavage ladder (OH). (D) Visual representation of structural data for the miscoding tRNA mutants. Sites of protection (blue circles) and enhanced cleavage (red circles) for the in-line probing assay and protection (green circles) for the T1 analysis are represented on a canonical tRNA clover-leaf structure (dots in the D and variable loops represent sites of varying length among tRNAs). Inclusion of sites was determined by comparison of individual positions to the WT molecule; the threshold for inclusion was a 2.5× difference from WT. Position 10 in all variants is protected in both assays.

