FIGURE 5.
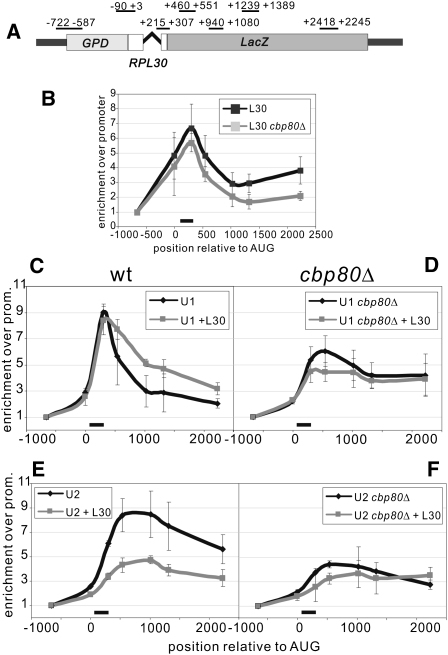
Cotranscriptional U1 and U2 recruitments on the RPL30-LacZ transcript in wt and cbp80Δ cells. Horizontal axes show the distance in nucleotides from the start codon. Vertical axes indicate the signal relative to that of the promoter (first primer pair, or PP1). The black bar indicates intron position. The ChIP profiles correspond to wt (panels C and E) or cbp80Δ cells (panels D and F), under normal conditions (black lines) or under L30 excess (gray lines). (A) Scheme showing the positions of the PCR primers used for the ChIP analyses of the RPL30-LacZ intron, relative to the translation start. (B) ChIP against L30 (L30-TAP). In both cases there is L30 excess (pMB73, see Materials and Methods). Black line, wt cells; gray, cbp80Δ cells. In the following panels, ChIP profiles of the indicated proteins are shown, performed on RPL30-LacZ. (C,D) ChIP against U1 snRNP (Snu71-HTB). (E,F) ChIP against U2 snRNP (Lea1-HTB).

