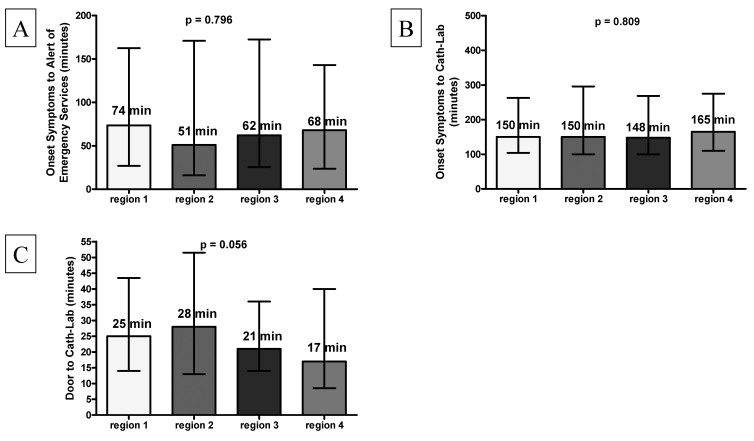
Figure 2.
Time to treatment delay. Bar graphs showing patient delay defined as time from onset of symptoms to alert of emergency services (panel A); time interval from symptom onset to arrival at the catheterisation room (cath lab) (panel B) and hospital delay expressed as time from arrival at the hospital to arrival at the cath lab (panel C). Top of bar represents median time (minutes). Error bars indicate 25th and 75th percentile (minutes). Abbreviations as in figure 1.

