
Figure 2.
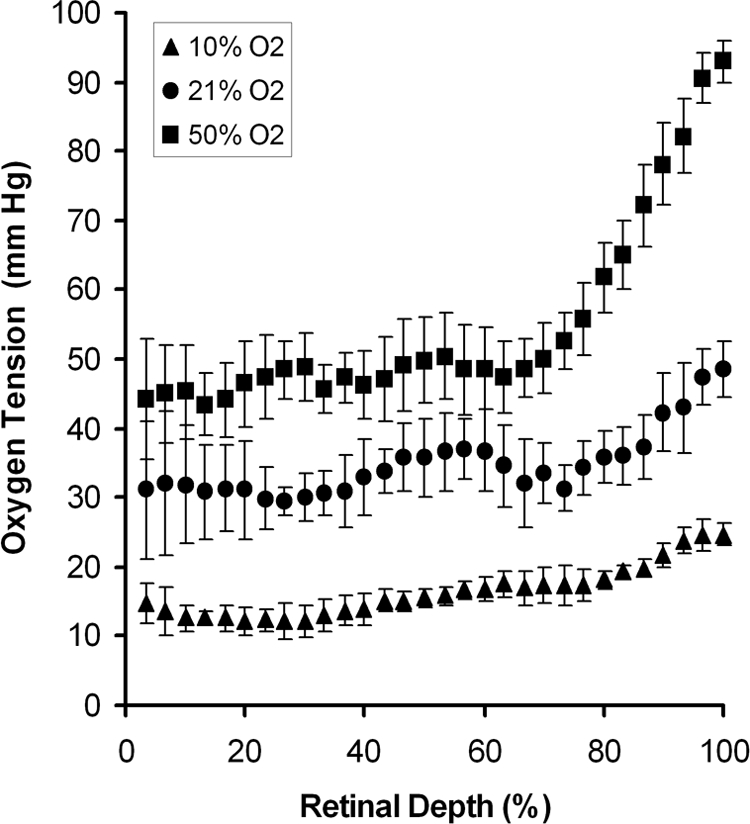
Oxygen profiles derived from retinal PO2 maps generated with 10%, 21%, and 50% FiO2 are shown. Each profile was obtained from a single segment of a retinal PO2 map. Error bars represent standard deviations.
Official websites use .gov
A
.gov website belongs to an official
government organization in the United States.
Secure .gov websites use HTTPS
A lock (
) or https:// means you've safely
connected to the .gov website. Share sensitive
information only on official, secure websites.
Oxygen profiles derived from retinal PO2 maps generated with 10%, 21%, and 50% FiO2 are shown. Each profile was obtained from a single segment of a retinal PO2 map. Error bars represent standard deviations.