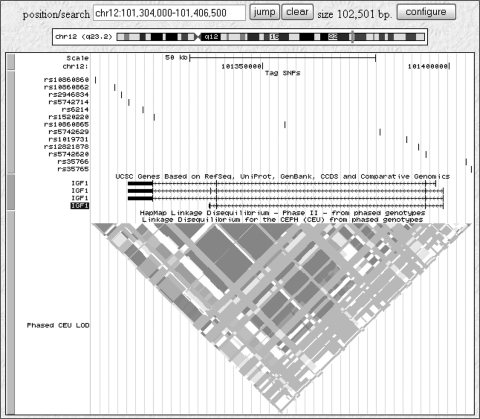
Figure 1.
Representation of the 13 SNPs selected for the IGF-1 gene (source; Human Genome Browser (http://genome.ucsc.edu/ provided in the public domain by UCSC Genome Bioinformatics, University of California at Santa Cruz). The HapMap linkage disequilibrium map for the region for European samples from the CEPH (30 trios) is also displayed.

